Showing posts with label Treasury market. Show all posts

Friday, October 26, 2012

Yields Go Up, Yields Go Down, and Event Study Tradeoff

Yields (constant maturity estimated by the Treasury Department) went up yesterday… cmNomYield-24thto25th

… and it went down today.

cmNomYield-25thto26th

Presumably, the increase yesterday has to do with supply issues, i.e.:

“Treasuries declined after the U.S. sale of $29 billion in seven-year notes drew of the least demand since May 2009.”

As for the fall today, a plausible explanation:

“Treasuries rose, pushing 10-year yields down from almost the highest in five weeks, as a report showing Spain’s unemployment rate at a record high raised concern the region’s debt crisis may worsen.” “There’s still a flight-to-quality bid being generated by concern for Europe,” said David Coard, head of fixed-income trading in New York at Williams Capital Group, a brokerage for institutional investors. “It’s a roller-coaster ride.”

These types of seesaw actions make event study hard. The problem can be alleviated by using intraday yield data, but that data is costly and you are still trading off measuring the effect of a particular news item versus trusting the market participant’s ability to evaluating the news and trade on it. For example, if you use a 5-minute event window to study the effect of the FOMC statement release – you hope the only relevant news within those 5 minutes is the FOMC release. That is likely. However, you are also trusting that the Treasury price will be able to reflect that news within the 5-minute window also. In some cases, the proper trade off isn’t clear.

Reference:  Treasuries Fall as Seven-Year Note Demand Is Least Since 2009 [Bloomberg],
  Treasuries Advance on Spain’s Jobless Rise After GDP [Bloomberg Businessweek].

Saturday, August 4, 2012

Floating Rate Notes

Felix Salmon on the Treasury Department's plan on the Floating Rate Notes:  Why Would Treasury Want To Issue Floaters? (Link here) One point he makes in the article about the potential reference rate:

Continuing in the mode of offering self-serving advice that would be bad for Treasury, the TBAC recommended that Treasury use the new GCF index as the reference rate for FRNs. This would put Treasury in a position of taking on private credit risk, since, if we had a 2008-style meltdown and general collateral (rates) widened out due to counterparty risk, Treasury's FRN borrowing costs would soar.

The data on the GCF index can be downloaded (here), but I find it interesting that the DTCC (Depository Trust & Clearing Corporation) only publish the data for the past year, even though the data does go back a little further than that and the amount of data is sufficiently small that it is hardly a computing resource drain.

Plotting what is available, here is the Repo Index with the corresponding Par value used to average out the index:

image

In addition to the potential counter-party risk that Felix mentioned, the figure below shows how the repo index is more volatile than the constant maturity rate that the Treasury Department calculates every day (Felix also make this point in his article). The constant maturity yield is also a potential for use as a reference rate, though the concern here is that there’s a potential conflict of interest if the Treasury use a reference rate that itself calculates. One way to alleviate that is to make the methodology of calculation the constant maturity public info. The calculation is currently not clearly specified by the Department.)

image 

I wonder given the relative volatility, would the use of the repo index deter some market participant from buying the instrument.

Reference: DTCC GCF Repo Index [DTCC],
  Daily Treasury Yield Curve Rates [Treasury Department],
  Why Would Treasury Want To Issue Floaters? [Seeking Alpha]

Tuesday, April 24, 2012

Technology and Auction Release Timing

Since the start of computer automation for the auction processes more than 20 years ago, the time it takes the Treasury Department to aggregate the auction bids and release the results has shorten drastically.

I checked the release time today for data relating to the 2-year auction today (April 24, 2012). For each auction, 2 pieces of information are released. For Treasury notes and bonds, the noncompetitive bidding closes at 12:00 p.m. EST. The results for the noncompetitive bidding is supposed to be released about 15 minutes before the close of competitive bidding (12:45 p.m. EST). The competitive bidder closes at 1 p.m. EST. Then the result to the auction is released soon afterwards. The figure below links to the result announcements and updates throughout the day (webpage here).

image

The preliminary noncompetitive results were released on about 12:46 p.m. EST (a minute later than the approximate official release time.) The auction results were released on 1:03 p.m. EST (i.e., 3 minutes after the bidder closes). The snapshot below from my iTouch shows the time of release.  (I was refreshing the webpage minutely while sitting in an econometrics class; I am on Pacific Standard time.)

photo

What this mean is that the after auction closes, the computer system aggregates the bids, calculate the equilibrium yield, and issue the results in minutes. In fact, if you check the PDF document property (figure below), the PDF creation date is 10:01:47 a.m. Assuming my PDF reader converted the creation time to PST, it means all the results were already complicated a minute 47 seconds after the auction closes.

FromClipboard

Monday, April 23, 2012

Salomon Brothers and Market Manipulation, 20 years ago

Quoted below is an excerpt on page C-3 of the Joint Report on Government Securities Market (1992), on a “practical joke” one Salomon employee tried to play on another. Two thoughts:

  1. This is the sort of reason why a customer would want to keep a close eye on his own statements. I sometimes wonder if we (I) put too much faith on the implicitly accuracy of our phone bills, credit card bills, stock portfolio/IRA statements, etc.
  2. Using customer funds without their knowledge continues to be an issue these days (example).

The excerpt, with added emphasis by me:

The February 7, 1991, 30-year bond auction. Salomon disclosed that it submitted an unauthorized customer bid in the amount of $1 billion in the February 7, 1991, $11 billion 3D- year bond auction as the result of a “practical joke.” Salomon claims that an employee arranged to have a customer submit a bid to a salesperson at Salomon for $1 billion of the 3D-year bonds as part of a practical joke on the salesperson. The Salomon employee was to have stopped the customer bid from actually being submitted and, following the auction, the customer was to complain that its bid was not filled. The Salomon employee was then to blame the salesperson for the failed bid.  

Salomon has stated that the employee attempted to prevent the customer bid from actually being submitted prior to the auction by crossing out the bid on the work sheet of the clerk responsible for calling in the bids. According to Salomon the clerk did not understand the  meaning of the cross-out and submitted the bid, which resulted in the customer being awarded  $870 million of the bonds, as the $1 billion bid was subject to 87 percent proration. After the auction, the $870 million in bonds was placed into the account of another Salomon customer and then sold from that account to Salomon, allegedly without the customer’s authorization. Salomon has stated that its customer confirmations were suppressed. As a result, Salomon bid $2.331 billion for its own account and $1 billion as a result of the “practical joke.” The combined total of the two bids represented 30.2 percent of the issue and thus did not exceed 35 percent of the public offering.

Friday, April 20, 2012

Back to the Future: US Treasury Market

I am reading a 1992 report by the Federal Reserve, the Treasury Department, and the SEC on the government securities market. The report was issued primarily as the result of the Solomon Brothers market manipulation in 1991. On page B-7, the report talks about how the Treasury can handle a “squeeze” in the market:

There are a number of methods which the Treasury could use to supply the market more of a given security, including (1) an auction, (2) an offering of additional supply in increments  through the Open Market Desk of the FRBNY (a “tap”), (3) an issuance window, and (4) an offer  to lend securities to government securities dealers using the FRBNY as fiscal agent.

For the 2008 financial crisis, #1 (here, here, here, and here) and #4 (here) were definitely used to ease liquidity/supply constrains in the Treasury market. I do not recall whether #2 and #3 were used.

I am working on a paper that will provide a more in depth look at the operations of the Treasury market over the financial crisis in 2008. Some googling leads me back to this 20-year old report. I am surprise that the issues then and the issues now have changed very little over the past 20 years.

Reference: Joint Report on the Government Securities Market, January 1992 [Treasury Department]

Monday, December 26, 2011

How Does Treasury Direct Work?

Since my research involves Treasury auctions, I recently signed up for Treasury Direct and bought $100 worth of 13-week bill. Ideally, I would have prefer to participate in the competitive bidding of the auction – which is a multi-unit sealed-bid second-price auction requiring participants to submit a schedule of bids (quantity and prices). But since it would be difficult to carry that out, I instead participate through the Treasury Direct system. The Treasury Direct is an electronic system set up by the Treasury Department to allow individuals to purchase Treasury securities – making me part of the group that makes up the noncompetitive bidders. Noncompetitive bidders are those bidders that bids for a quantity. They are guaranteed to win the quantity they asked, in exchange for promising to pay the price determined by the competitive auction.

My main conclusion is that there are virtually zero reasons for individuals to buy Treasury bills. My $100 worth of 13-week bill yields an interest of zero.

The Treasury Department takes user security seriously. Before a recent change, you are mailed a code card to use for logging into the website. However, the system now is more in line with other financial institutions – only requiring clicking in your password to make keyboard capturing difficult, and setting up a personalized message and phrase to alleviate phishing. Here is the password login page:

Untitled picture 4

What I did not know before using Treasury security is the existence of Treasury securities named Payroll C of I and Zero-Percent C of I. The next figure is the Treasury’s explanation of what they are. My best guess for their raison d’ĂȘtre is to facilitate the purchase of securities – since transferring money between the Treasury and the checking account can take a day or two. For this benefit, the user is essentially providing a loan to the US Government. Given that C of I are not “money,” these are essentially 0% very-short-term securities.

Untitled picture 3

The next figure provides detail on the Treasury bill I purchased. Notice that I pay $100 for the securities, and after 3 months, I got back $100. The auction result for my security is here. Since the price of the securities is actually $99.994944, I should get an interest of $0.005056. Since I get back only $100, I can only assume either the Treasury does not round up, or it follows the rounding rule where 0.50 – because the digit following ‘5’ is ‘0’– is rounded down.

Untitled picture 1

Finally, here are the options available to a user of Treasury Direct who is interested in purchasing Treasury securities:

Untitled picture 2

If you select to purchase Treasury bills, you will see a list of securities to purchase, as well as a list of parameters relating to the purchase:

image

Thursday, October 27, 2011

Constant Maturity Yield Changes for Today (The Day after the Day after Yesterday)

This should be the last in a series of 3 posts. The constant maturity yields estimated by the Treasury Department (data here) today gain another 23 points at the 20-year and 30-year maturity. I assume the yields are driven by the event depicted in this article: EU Crisis Deal Buys Time for Greece: Papandreou.

cmNomYield

Interestingly, the chart below shows that the yields on the Japanese Government Bonds head toward the opposite direction. (Data is here)  Sometimes, the discrepancy is due to the difference between the market close times for the US and Japan markets. But the change in yield has been negative for the past two days. Also, the change in yield is relatively small. JPNcmNomYield

Reference: Bloomberg [Bloomberg]

Wednesday, October 26, 2011

Constant Maturity Yield Changes for Today (The Day after Yesterday)

Constant maturity yields estimated by the Treasury Department (data here) today recover 9 basis points at the 20-year and 30-year maturity.

cmNomYield

The volatility in asset prices is why one should always take event studies with a grain of salt, and especially the choice in window size. A lot of papers on Quantitative Easing effects (my area of research) use event studies. A couple of examples include Gagnon, Raskin, Remache, and Sack (2011) and Swanson (2011).

Here are the headlines on Bloomberg’s main webpage at the moment (3:12pm October 26, 2011).

Banks: No EU Deal Yet on Greece
Supercommittee Dems Said to Pitch $3T Plan
U.S. Stocks Advance as EU Bank Agreement
UAW Members at Chrysler Ratify Labor Contract
Apple May Gain as VA Seeks Device Security
Bove: Goldman May Get ‘Windfall’ If It Buys MF
Stanford Proposes NYC Engineering Campus
Aflac’s Third-Quarter Profit Advances 7.8%
Trader Kupersmith Indicted for $60M Fraud

Reference: Bloomberg [Bloomberg];
  Joseph Gagnon & Matthew Raskin & Julie Remache & Brian Sack, 2011. "Large-scale asset purchases by the Federal Reserve: did they work?," Economic Policy Review, Federal Reserve Bank of New York, issue May, pages 41-59; 
  Eric T. Swanson, 2011. "Let’s twist again: a high-frequency event-study analysis of operation twist and its implications for QE2,"Working Paper Series 2011-08, Federal Reserve Bank of San Francisco.

Tuesday, October 25, 2011

Constant Maturity Yield Changes for Today

Constant maturity yields estimated by the Treasury Department (data here) felt 14 basis points at the 20-year and 30-year maturity.

cmNomYield

Despite the description in the “About Me” box on the right side of the blog, I rarely talk about automation. The graph above is an example of the type of automation I do to help me keep tabs on the economy. My Linux computer runs a bash script everyday to get the constant maturity yield data from the Treasury Department website, and then the script uses Matlab to generate the graph. Finally, it emails me the graph by email. If the change in yield is large, the email adds the words “(LARGE MOVEMENT)” in the email subject.

Today, the yield changes are quite large. The numbers in the title of the graph are the day to day yield change. The top graph plots the yield curve for the past two days. The bottom graph plots the change in a bar graph. The email helps me keep tab on the economy – since large movement in the Treasury yields are usually meaningful. Of course, it is often difficult to pinpoint why.

However, for today at least, I am guessing the drop in yields is related to the Europe situation. Here are the headlines on Bloomberg’s main webpage at the moment (6:00pm October 25, 2011).

Asia Stocks Fall as Europe Uncertainty Grows
Japan Signals Coming Action as Yen Hits Record
Chinese Banks’ Profits May Not Lift Valuations
Amazon Profit Plunges; Shares Tumble
Australia Inflation Slows, Currency Declines
BlackRock Expects “Massive” Mining M&A
IBM Names Ginni Rometty as First Female CEO
Merkel Puts Rescue Fund to German Vote
S. Korea Growth May Slow, Pressuring BOK

Reference: Bloomberg [Bloomberg]

Sunday, July 31, 2011

Treasury Auctions Response to the Debt Ceiling

Felix Salmon commented that the short end of the yield curve has risen quite a bit on Friday, as the debt ceiling issue looks less likely to be resolved by August 2. My research involves financial markets in general and Treasury market in particular, usually with relevancy to monetary policy. I have been working on information implied by Treasury auctions lately; from auction data, it seems primary dealers and direct bidders are shying away from the short Treasuries Bills, but there are still indirect bidders willing to support the market for a higher yield.  The rest of the entry talks about how I arrive at this conclusion.

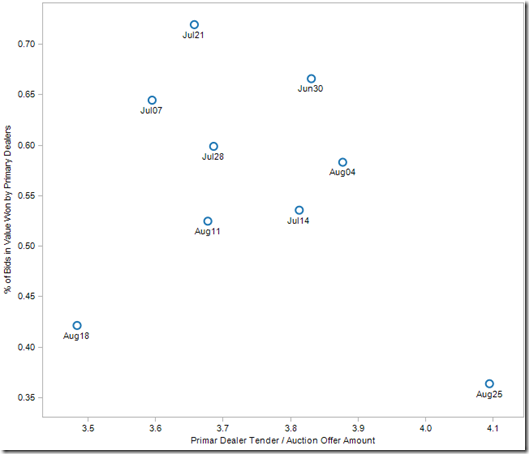
Here I look specifically at 4-week bills auctioned since June, with maturity dates surrounding the August 2 deadline.  There are nine observations total, with the last one on July 26 (Tuesday). While auctions reflect the interactions of market participants in the primary market of the Treasury, they are informative since these same participants also interact in the secondary market. Furthermore, the auction market supply us with additional information that equilibrium points in the secondary market that makes up the yield curve might not. The main drawback of using auction data is that the number of observations is weekly at best. Also, the composition of auction participants is different from those in the secondary market. For the sample here, the primary dealer bids makes up 80% of the total bids. (11.8% for direct bidders and 7.9% for indirect bidders)

The following figure plots the high discount rate (the rate of the 4-week bill determined by the auction). The X-axis plots the maturity date and the Y-axis plots the high discount rate. For the last auction on July 26 (and matures August 25), the high discount rate is relatively higher than the others.

image

Like Salmon’s commentary, it appears that concerns about the debt ceiling have started to affect the auction market – even for an auction that was auctioned Tuesday. The auction data allows us to dig in a little deeper about the compositions of the bidders.

In a Treasury auction, any bidder can submit multiple bids of varying amounts for difference prices. Until the recent auction, primary dealers as a group has won anywhere from 40 to 70% of the amounts they bid (Y-axis), and the amount of bids are usually 3.5 to 3.9 times the amounts offered in an auction (X-axis). The figure below shows that the primary dealers has been winning less securities than average (Y-axis), even though the normalized amount of competitive tender (X-axis) they submit for the auction has been increasing. Furthermore, for the most recent auction, they win a very low percent of the auction.
image

So what was the outcome of the most recent auction for the other two groups of bidder? The figure below is for direct bidders. The amount of bids are lower than average, but surprisingly, like the primary dealers, the direct bidders too are winning a relatively lower amount of bids.

image

Finally, for the indirect bidders, the figure below shows that they too are offering a higher amount of bids, as indicated by the relatively higher points for bills with August maturity dates. In fact, it seems they win a relative larger portion of the auctions that the primary dealers and direct bidders forgo. It also seem strange to me that the indirect bidders bid aggressively – that three of the 4 auctions for 4-week Bills maturing in August have a relatively high bid-cover ratio for the group.

image